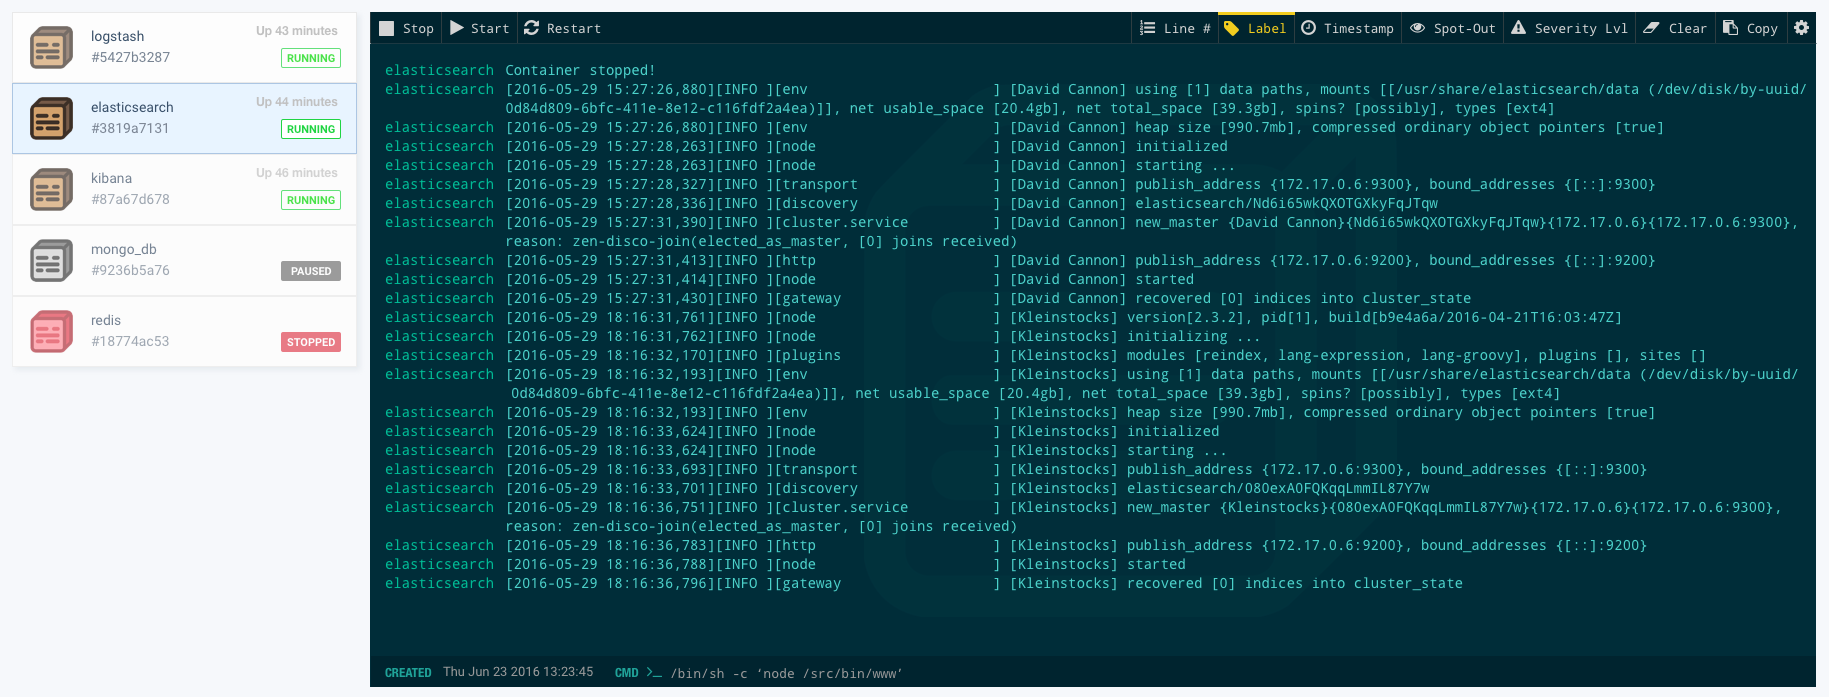
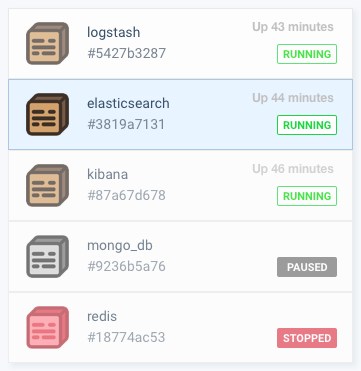
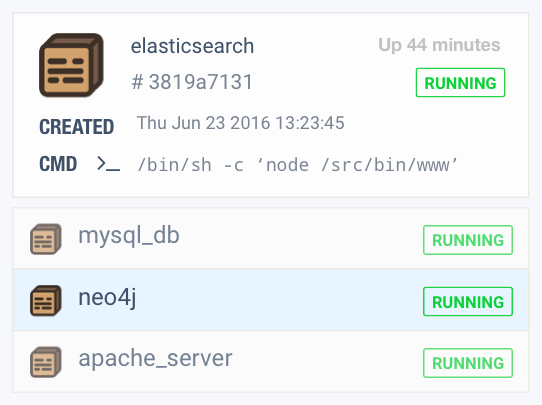
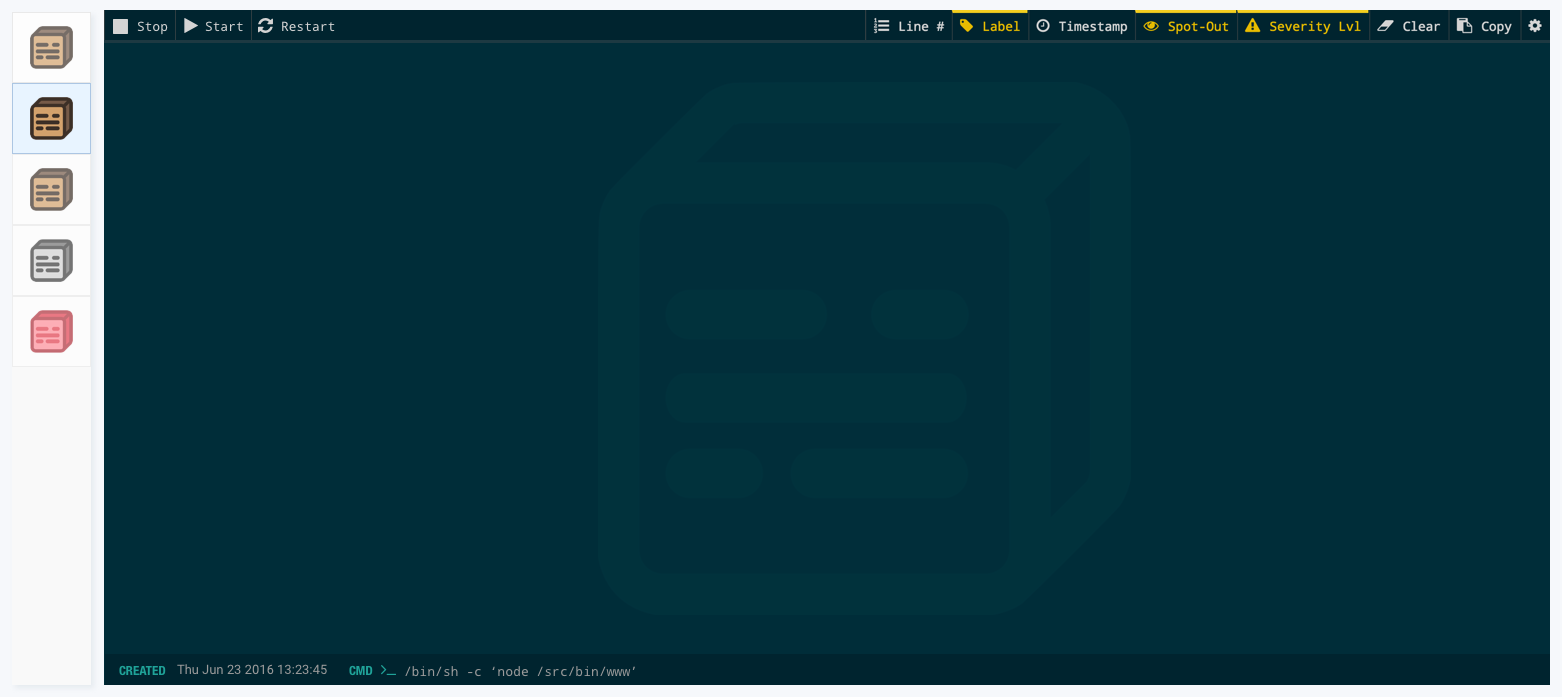
Dlogger aims to help with the management and log monitoring of projects that handle multiple Docker containers, with an easy to use graphical user interface. The name of the project Dlogger is a portmanteau, combining the terms Docker and Logs.
Dlogger = Docker containers + Logs monitoring
The set-up of a virtualized environment using Docker containers, can result on a big overhead and time consuming, that might require multiple terminals and commands that are rarely used (which implies constant checks to notes or the Docker API documentation). When creating this project I wanted to ease these pain points that where not already covered by any other single solution out in the market.
A single GUI tool to do the most common operations when dealing with Docker container environments. All these objectives could be achieved by the use of multiple tools, which setting up all these by itself will cost more time and effort than the diagnosis and monitoring activity itself.
Manage different docker container machines with a simple graphical user interface. Reduce time spent on setting up a new project environment.
Easily monitor the status of different machines in real time. Use a web GUI to monitor all the remote servers.
Perform fast analysis of logs, highlighting common key words for easy scanning. Spot out file paths, IPs, timestamps etc. or your custom regex.
All common operations in one click: restart, halt, resume, etc. Switch between containers like switching between browser tabs.
All common actions are placed at a handy location on the top of the web terminal. These are divided into different groups and all placed on the action bar.
Docker container actions such as "Stop", "Start", or "Restart" are placed on the left side of the action bar. On the right hand side we can find all actions related to log highlighting and analysis, such as adding a Timestamp if not included already, show the container Label, or the Severity level. In addition there are common actions like Clear or Copy that might come handy when sharing the output of the logs in forums, etc.
Having all these actions available in one place at all times, makes it a breeze to spot out the relevant information and act accordingly. No need to deep dive into the terminal running parallel screens with instructions one rarely uses; but rather focus on troubleshooting the errors themselves.
Typically a microservices project will contain multiple Docker containers running in parallel. When exploring the different ways to switch between container logs, I finally opted for the familiar interaction typically found in browsers as Tabs to switch between pages. Below are some of the visual representations of the options explored.
In order to provide maximum space for long log lines, the tabs where able to show different amounts of information depending on the interest of the user. These could be collapsed, semi-collapsed and completely open.
When the tabs where semi-collapsed, one could only see the status of each container by a the color of the icon. Since most often, different microservices are talking to each other, during development an action in one container can cause the crash of those interacting with it. For this reason, it is sometimes enough information when debugging.
Skimming through logs, or large amounts of text requires great attention and focus that can strain our eyesight. In addition, there is common values found on the logs from different systems, such as: time and date values, file paths, IPs, emails, severity levels, etc.
When clicking on the Spot-Out button, we are activating different regular expressions pre-programmed to highlight these, making them stand out and facilitating the analysis of log output.